


 5 / 136

5
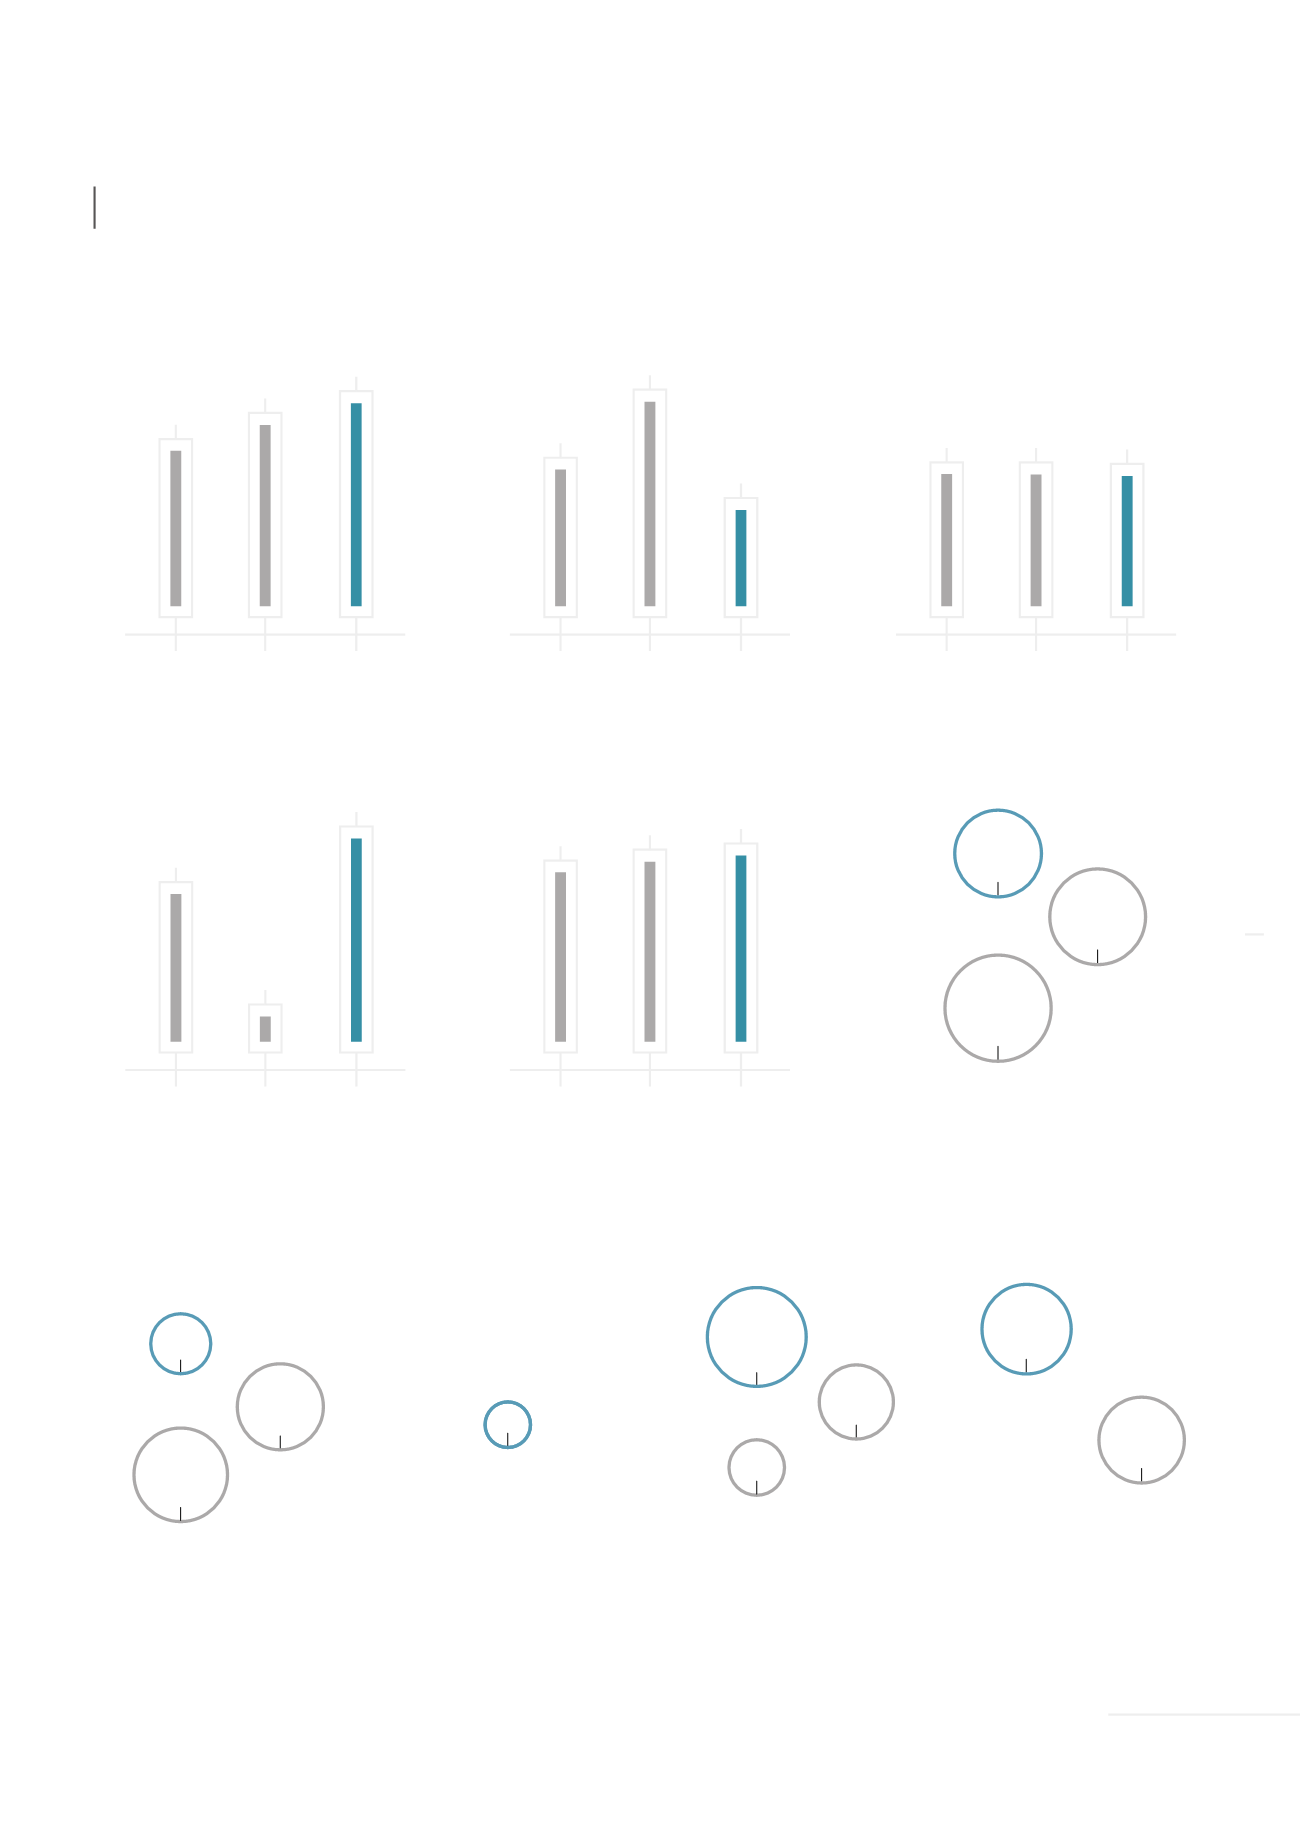
Sustainable solutions
(SPM)
(as percentage of net sales)
Employee engagement index
(as percentage)
2013
8.84
2013
1.06
2013
19
7.26
2015
0.77
2015
33
2015
Greenhouse gas intensity
(Kg CO
2
eq. per
€
REBITDA)
8.08
2014
0.97
2014
25
2014
Employees involved
in societal actions
(as percentage)
Dividend**
(in
€
)
Adjusted Net Income, Solvay Share
(in
€
million)
75
2015
72
2013
20
2015
Occupational accidents
at Group sites
(rate of accidents with medical
treatment, with or without
work stoppage)
(per million hours worked)
* Recommended to the Ordinary Shareholders' Meeting scheduled on May 10, 2016.
** The 2013 and 2014 historical data have been ajusted for the bonus factor of 0.9398 resulting from Solvay's right issue completed in 2015.
KEY FIGURES
SOLVAY
|
2015 COMPLEMENTARY ANNUAL REPORT
KEY FIGURES
REBITDA
(in
€
million)
Free Cash Flow
(in
€
million)
CFROI
(as percentage)
SOLVAY (EXCLUDING CYTEC)
AS OF DECEMBER 31, 2015
2015
1,955
2014
1,783
2013
1,611
2015
477
2014
156
2013
378
2015
3.30*
2014
3.20
2013
3.01
2015
387
2014
656
2013
487
2015
6.9
2014
6.9
2013
6.9